What Is the Cleanest Country in the World in 2026?
- How cleanliness is measured
- Which country is the cleanest right now
- Why the leading countries stay clean
- What the rankings mean for residents, immigrants, and travelers
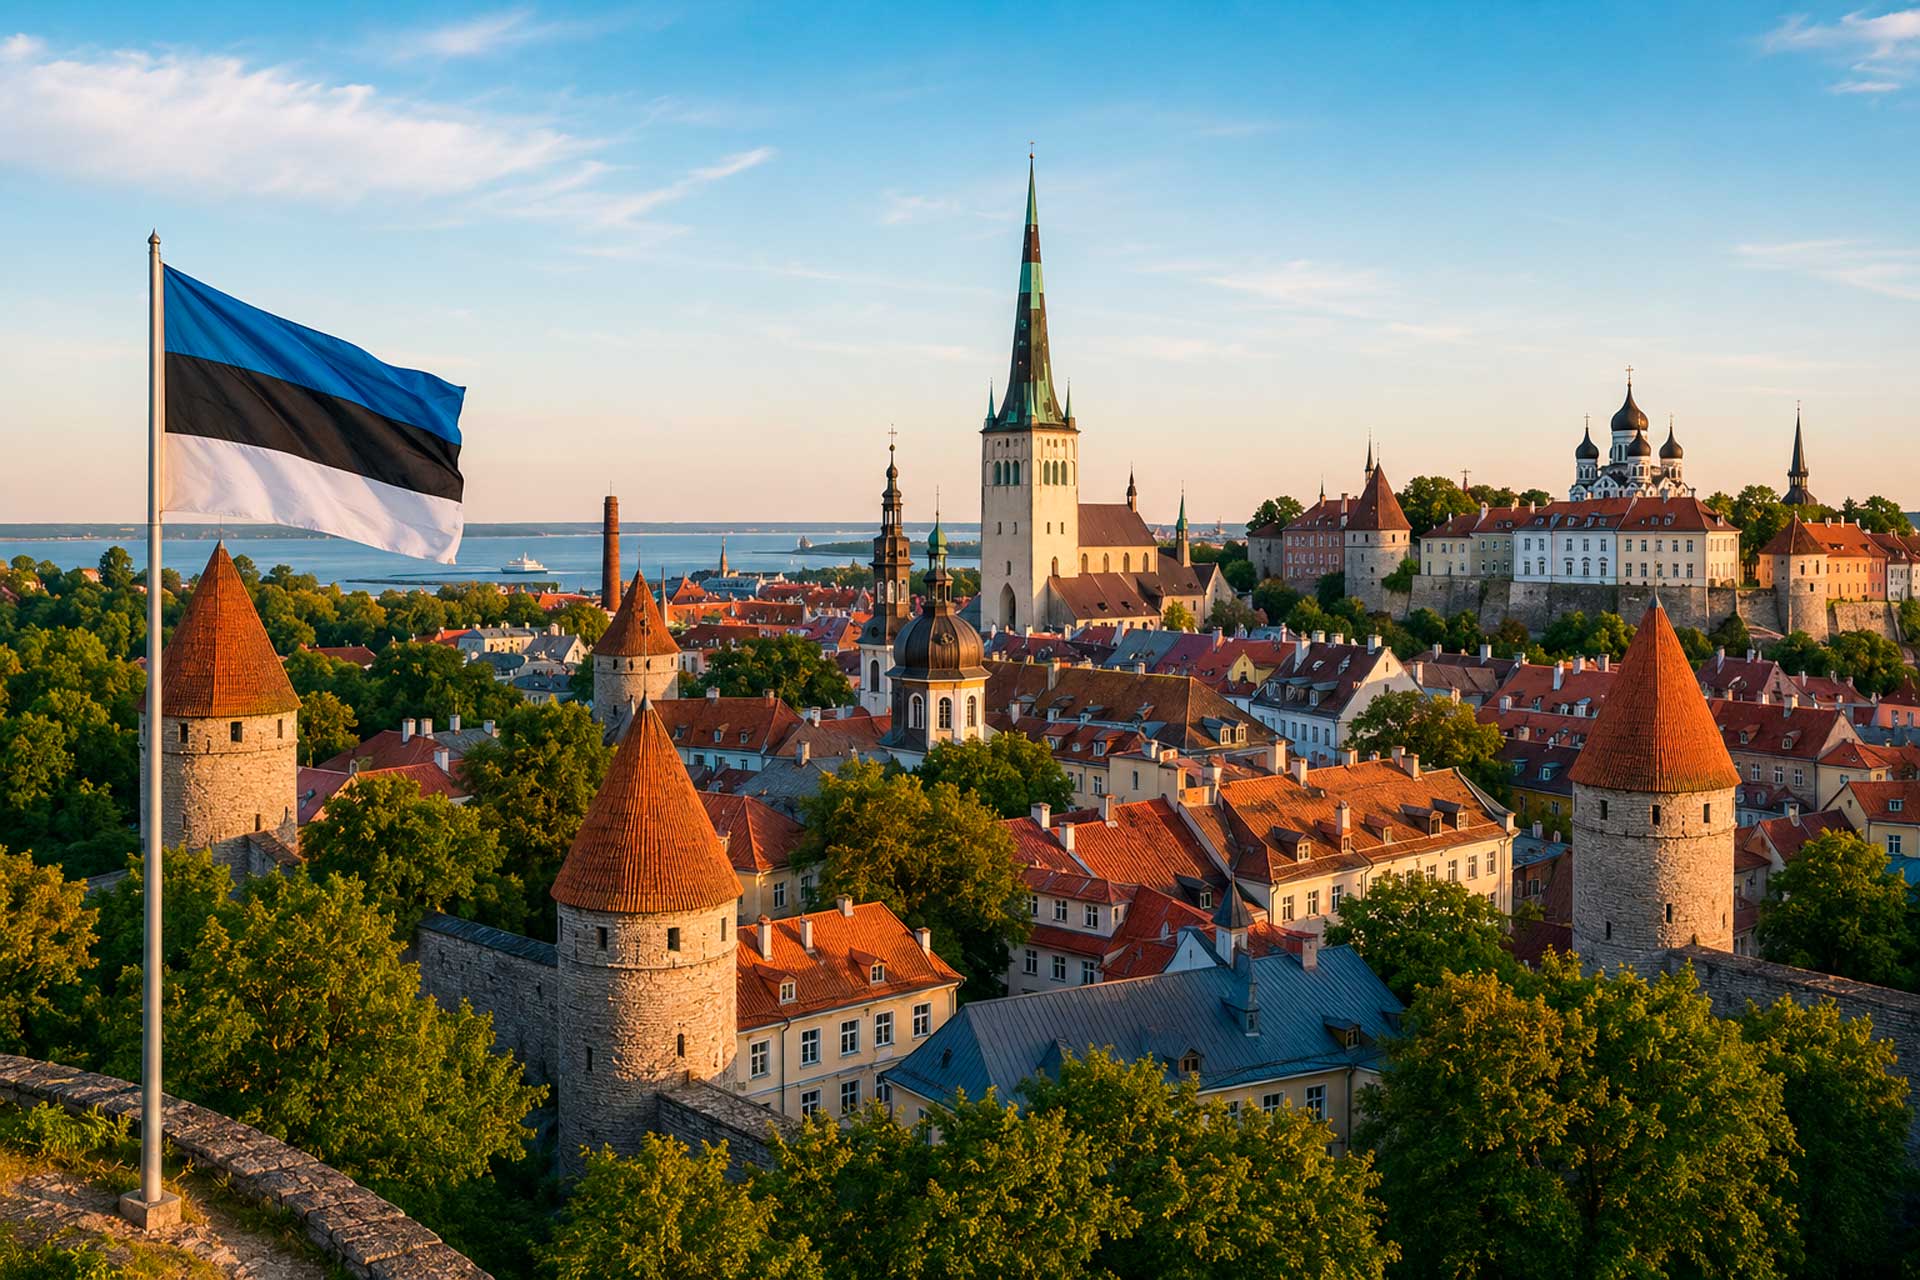
If “cleanest country in the world” means the strongest overall environmental performance on a broad, reputable international index, Estonia is the clearest current winner. The latest Environmental Performance Index ranks Estonia No. 1 overall among 180 countries, ahead of Luxembourg, Germany, Finland, and the United Kingdom. The index is one of the most comprehensive cross-country scorecards in use, combining 58 indicators across climate, environmental health, and ecosystem vitality.
That said, there is no single universal definition of “cleanest.” Estonia leads overall, but the country with the cleanest air in a given year may differ from the country with the best recycling system, the safest tap-water coverage, or the largest protected-area share. In the latest comparable data used here, Estonia stands out on overall performance and very low PM2.5 levels; Germany stands out on municipal recycling; Luxembourg and the UK stand out on protected areas; and Finland and Sweden are exceptionally strong on water and sanitation indicators.
For readers, residents, immigrants, and travelers, the practical takeaway is simple: the cleanest countries combine low air pollution, safe drinking water, reliable sanitation, effective waste systems, and environmental policy that is actually enforced. That combination matters for everyday life far more than any single headline ranking.
How cleanliness is measured
This article uses a multi-metric approach rather than relying on a single list. The backbone is the 2024 Environmental Performance Index, which covers 58 indicators across 11 issue categories and ranks 180 countries. The EPI weights its results across Environmental Health, Climate Change, and Ecosystem Vitality, making it one of the strongest broad proxies for national “cleanliness” and environmental quality.
To make the comparison more tangible, the article also uses several specific indicators. For air quality, it uses country PM2.5 annual averages; for water and sanitation, it uses safely managed drinking water and sanitation services from the WHO/UNICEF Joint Monitoring Programme as published through World Bank data; for biodiversity, it uses protected-area coverage based on Protected Planet / World Bank data; and for waste performance, it uses the latest accessible official or high-quality national/European waste statistics.
A brief caution matters here. Waste statistics are the least “plug-and-play” indicator in international comparisons. Eurostat notes that recycling definitions, municipal-waste coverage, and reporting rules vary, and some countries also publish parallel national methods. Finland is a good example: its 2023 municipal recycling rate is reported as 45% under Method 4 but 51% under Method 2. That is not a contradiction so much as a reminder that methodology shapes rankings.
Air quality also needs context. The World Health Organization’s annual PM2.5 guideline is 5 µg/m³, and WHO says the combined effects of ambient and household air pollution cause about 7 million premature deaths a year. So a country can look visually tidy and still underperform on one of the most important “cleanliness” measures for human health.
Thinking about moving to one of the world’s cleanest countries? Whether you’re interested in a residence permit, permanent residency, or citizenship, our immigration experts can help you choose the right pathway. Leave a request for a consultation and receive personalized guidance.
Schedule a free consultation and get detailed information from Unioncitizenship lawyers. Start the process today!

Which country is the cleanest right now
The most defensible overall answer is Estonia. Yale’s latest EPI ranks Estonia first overall, with Luxembourg second, Germany third, Finland fourth, and the United Kingdom fifth. Sweden is not top five overall, but it remains essential in any serious discussion because it combines very strong air, water, and waste-policy outcomes with one of Europe’s most mature circular-economy cultures.
Comparative table
| Country | Latest overall standing | PM2.5 annual average | Safely managed drinking water | Safely managed sanitation | Protected areas | Waste management snapshot | What stands out |
|---|---|---|---|---|---|---|---|
| Estonia | EPI #1, score 75.7 | 4.9 µg/m³ | 99% | 91% | 20.5% | 47% municipal recycling in 2023 | Best overall balance across air, climate, and environmental management |
| Luxembourg | EPI #2, score 75.1 | 7.4 µg/m³ | 100% | 96% | 39.1% | 55.3% municipal recycling in 2021 | Outstanding biodiversity/protected-area profile and near-perfect water metrics |
| Germany | EPI #3, score 74.5 | 9.4 µg/m³ | 100% | 97% | 40.0% | 67.2% municipal recycling in 2023 | Best recycling performance in this comparison |
| Finland | EPI #4, score 73.8 | 5.2 µg/m³ | 100% | 90% | 13.5% | 45% in 2023 under Method 4; 51% under Method 2 | Exceptionally low air pollution and very strong environmental-health performance |
| United Kingdom | EPI #5, score 72.7 | 8.7 µg/m³ | 100% | 98% | 42.1% | 44.6% household recycling in 2023 | High protected-area share and strong sanitation/water access |
| Sweden | EPI #6, score 70.5 | 5.5 µg/m³ | 100% | 95% | 15.9% | 39% recycled; 59% turned into energy in 2023 |
Elite sanitation-and-water performance and a highly developed waste-to-energy system |
Table sources and notes: EPI standings from Yale’s 2024 Environmental Performance Index; PM2.5 from IQAir’s latest country rankings; drinking water and sanitation from World Bank/JMP 2024 data; protected areas from World Bank/Protected Planet 2025 data; waste metrics from official national or European sources, with year differences shown because waste-reporting methods are not fully harmonized.
The table shows why the question is trickier than it first appears. Estonia wins the broadest overall test, but Germany has the strongest accessible municipal-recycling figure in this group, the UK and Luxembourg have larger protected-area shares, and Finland is closer to the WHO PM2.5 benchmark than Germany, Luxembourg, or the UK. In other words, the “cleanest country” depends on whether a reader values health exposure, ecosystems, waste performance, or broad policy balance most heavily.
A second important point is that visual cleanliness and environmental cleanliness are not identical. A place can look orderly to a tourist yet still have worse fine-particle exposure or weaker biodiversity protection than a less polished-looking country. That is why metrics like PM2.5, wastewater treatment, sanitation, and protected-area coverage matter more than travel impressions alone.
Why the leading countries stay clean
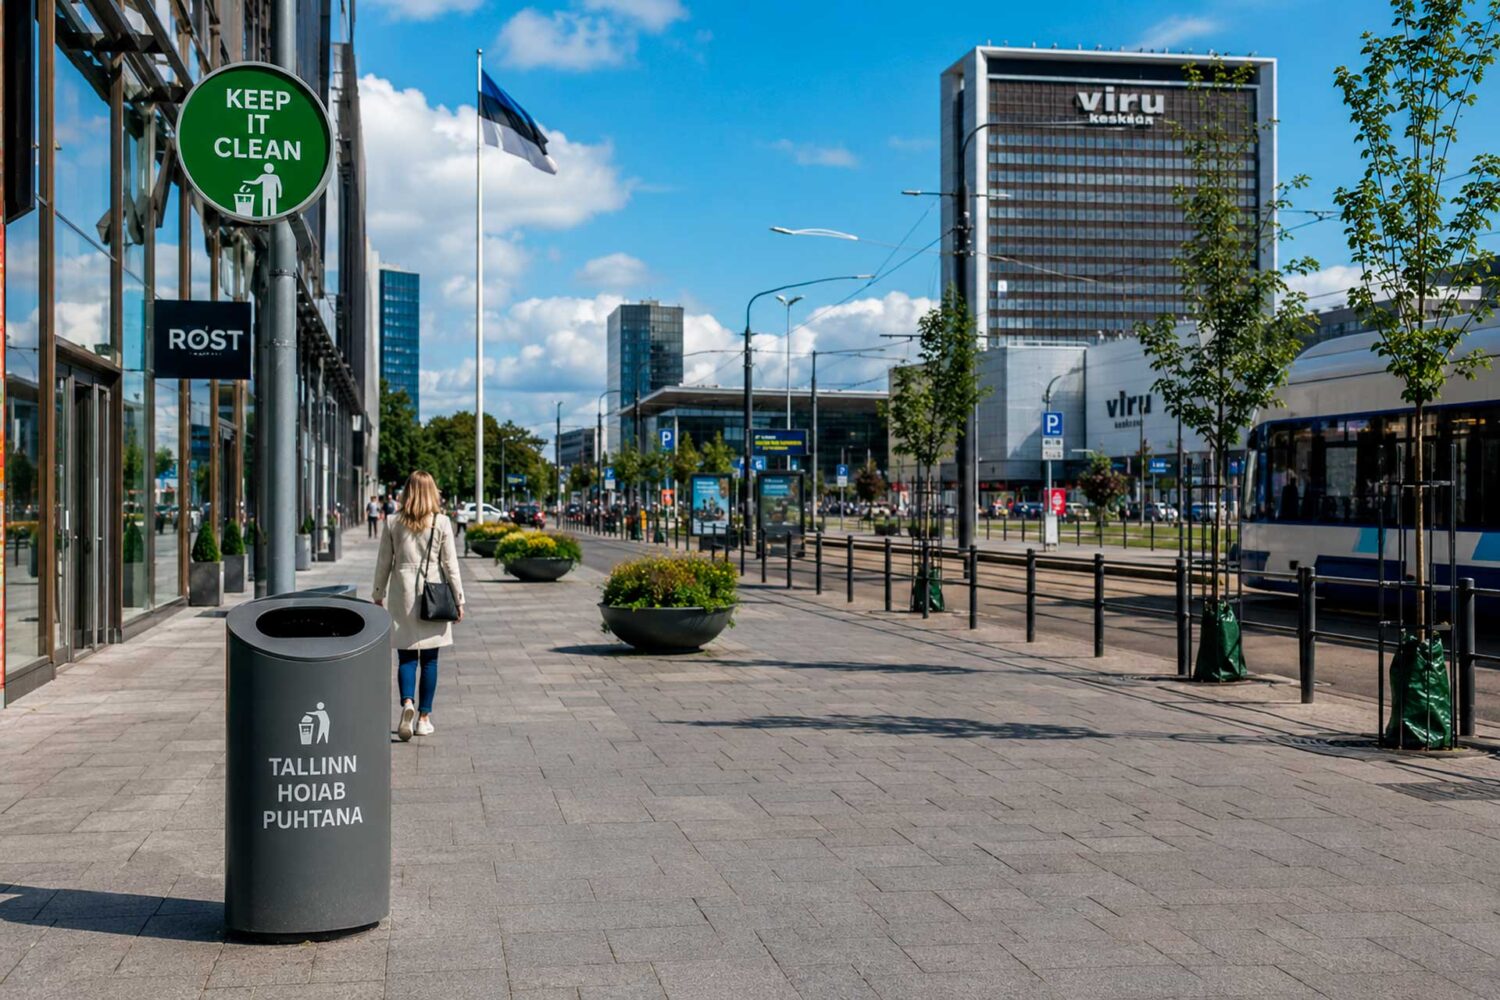
Estonia’s rise is not just a ranking quirk. It reflects a pattern of policy choices that compound over time: structured waste systems, strong climate performance, improving circular-economy planning, and low particulate pollution. Yale’s country profile places Estonia first overall and also first on Climate Change, while IQAir’s latest country data puts Estonia at 4.9 µg/m³ PM2.5, close to or at the WHO annual guideline threshold. World Bank/JMP data also show 99% safely managed drinking water and 91% safely managed sanitation, which is strong by global standards even if not perfect.
Estonia’s everyday systems help explain that performance. The country’s deposit-return operator, Eesti Pandipakend, has run a nationwide beverage-container system since 2005, and by 2025 it reported that 6 billion packages had already been directed back into the circular stream. Estonia’s current National Waste Management Plan 2023–2028 is designed to reduce waste generation, encourage reuse, and even introduce real-time waste-management monitoring.
Sweden shows a different model. It is not the No. 1 country overall, but it demonstrates how strict sorting rules, energy recovery, and public compliance can keep urban environments highly functional. Sweden’s official national communication says that in 2023 about 39% of municipal waste was recycled and 59% was converted into energy, while a 2024 law made food-waste separation mandatory for households and businesses. That is a good example of how cleanliness is maintained not only through infrastructure, but through rules people actually follow.
Germany’s strength lies in waste handling and resource recovery. Germany’s Federal Environment Agency reports that the municipal recycling rate rose from 56% in 2002 to 67.2% in 2023, comfortably exceeding the German government’s earlier 65% target. Germany is therefore a reminder that a country does not need the lowest PM2.5 in Europe to rank among the cleanest overall if it performs extremely well on circularity, sanitation, and ecosystem protection.
Finland is especially strong on policy architecture. The Finnish Ministry of the Environment says the National Waste Plan to 2027 supports recycling and circular-economy objectives, while the government’s circular-economy programme aims to make circularity a new foundation for the economy by 2035. Finland’s environmental-health performance in Yale’s 2024 EPI is particularly strong, and its PM2.5 levels remain among the lowest in Europe.
Denmark, even though it is outside the main comparison table above, is worth mentioning because it illustrates another successful policy pattern: deposit returns and long-horizon circular targets. Denmark’s circular-economy action plan sets a 65% municipal-recycling target for 2035, and official Danish materials cited in that plan report 94% separate collection of plastic bottles. Denmark’s deposit system has also consistently achieved around 90% collection for beverage containers.
The common thread is not geography alone. It is boring competence: universal basic services, credible enforcement, investment in wastewater and waste systems, protected nature, and long-term policy continuity. That is what turns “clean” from a slogan into a measurable national outcome.
Considering Estonia or another environmentally friendly destination? We provide expert support with residence permits, permanent residence, and citizenship applications. Leave a request and speak with an immigration specialist.
Schedule a free consultation and get detailed information from Unioncitizenship lawyers. Start the process today!

What the rankings mean for residents, immigrants, and travelers
For residents and newcomers, these rankings are not just abstract sustainability scores. They often correlate with cleaner air exposure, high confidence in tap water, stronger sanitation systems, and lower visible litter in daily life. The benefits are practical: healthier commuting, cleaner public spaces, and fewer environmental-health risks. WHO’s health burden data explain why this matters so much: air pollution remains one of the world’s biggest environmental killers.
For immigrants, another implication is that many of the cleanest countries also expect more from households. Sorting rules can be strict. Deposit-return systems are common. Food waste may have to be separated. Local governments often assume that residents understand recycling categories, wastewater rules, and protected-area etiquette. In countries like Sweden and Estonia, these are not niche practices; they are part of normal civic life.
For travelers, three practical habits go a long way.
- First, learn the local deposit-return scheme, because beverage containers are often treated as recoverable materials rather than trash.
- Second, assume that tap water is generally reliable in the countries topping these rankings, unless local signage says otherwise.
- Third, respect trail, park, and waste-separation rules, because countries with strong protected-area coverage and good waste systems often enforce them more consistently than visitors expect.
The best evidence-based answer today is this: in 2026 Estonia is the cleanest country in the world overall, at least on the broadest recent international environmental ranking. But the fuller and more useful answer is that “cleanest” is a bundle of strengths, not a single trait. Estonia leads on overall balance. Germany is stronger on recycling. Finland and Sweden are especially impressive on environmental health and daily-system discipline. Luxembourg and the UK show how biodiversity protection and universal services elevate a country’s overall cleanliness profile.
For readers choosing where to live, work, study, or travel, the smartest filter is not “Which country looks the cleanest?” but rather: Which country combines clean air, safe water, good sanitation, effective waste systems, and credible environmental policy? On that broader test, Estonia currently has the strongest case.
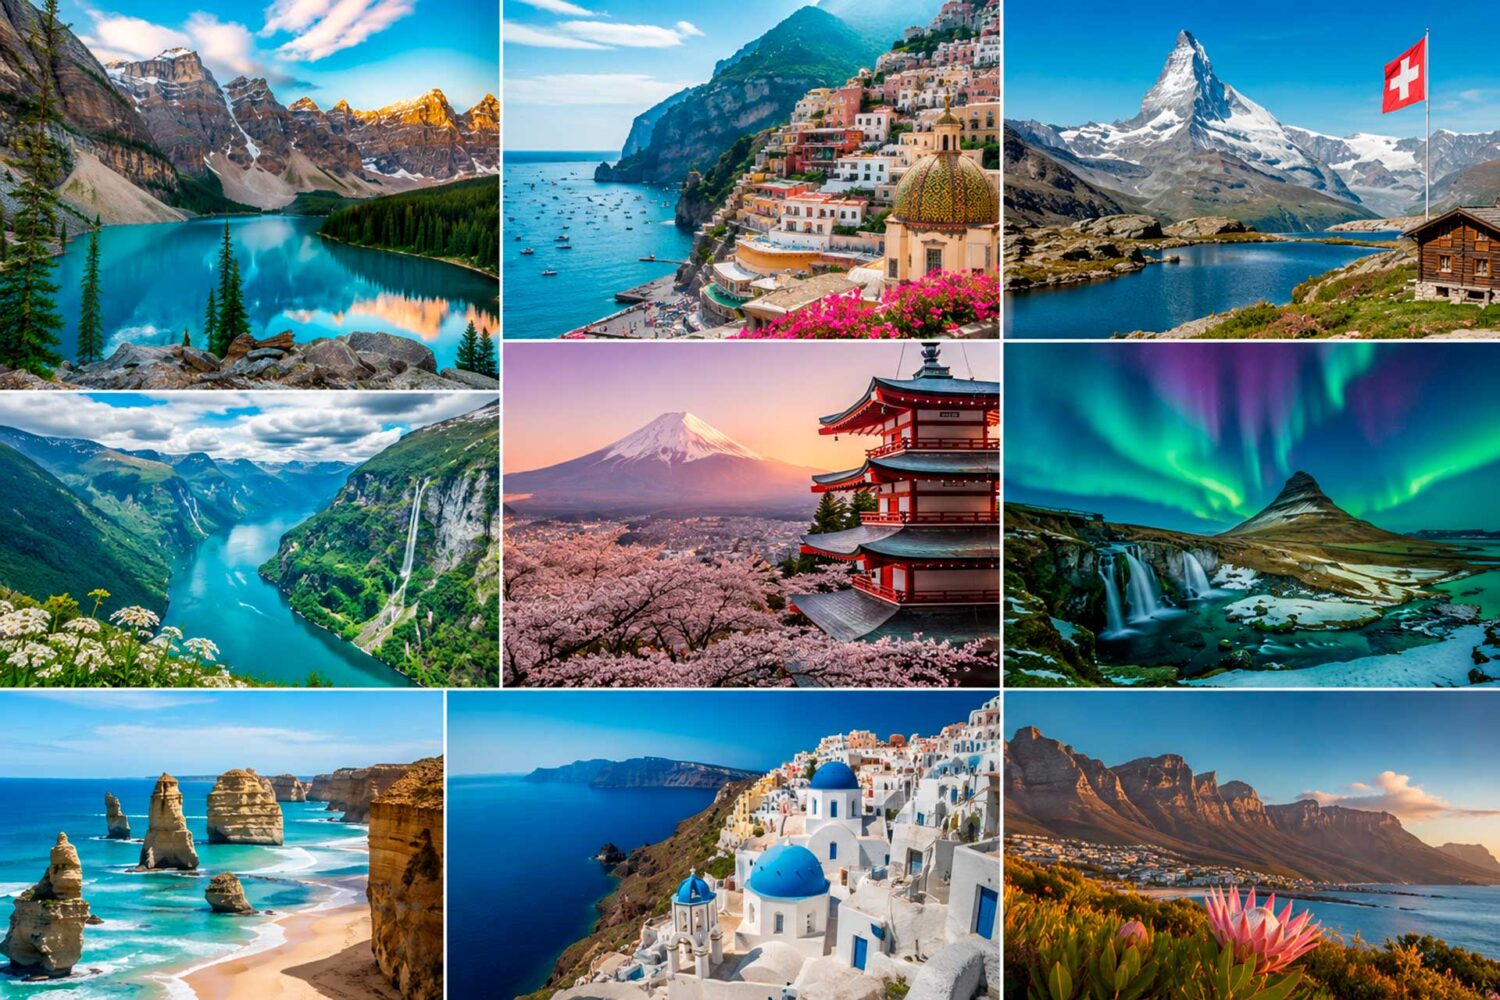
Want to live in a cleaner, greener country? Our specialists can help you explore immigration opportunities, compare destinations, and find the best solution for your goals. Contact us for a personalized consultation.
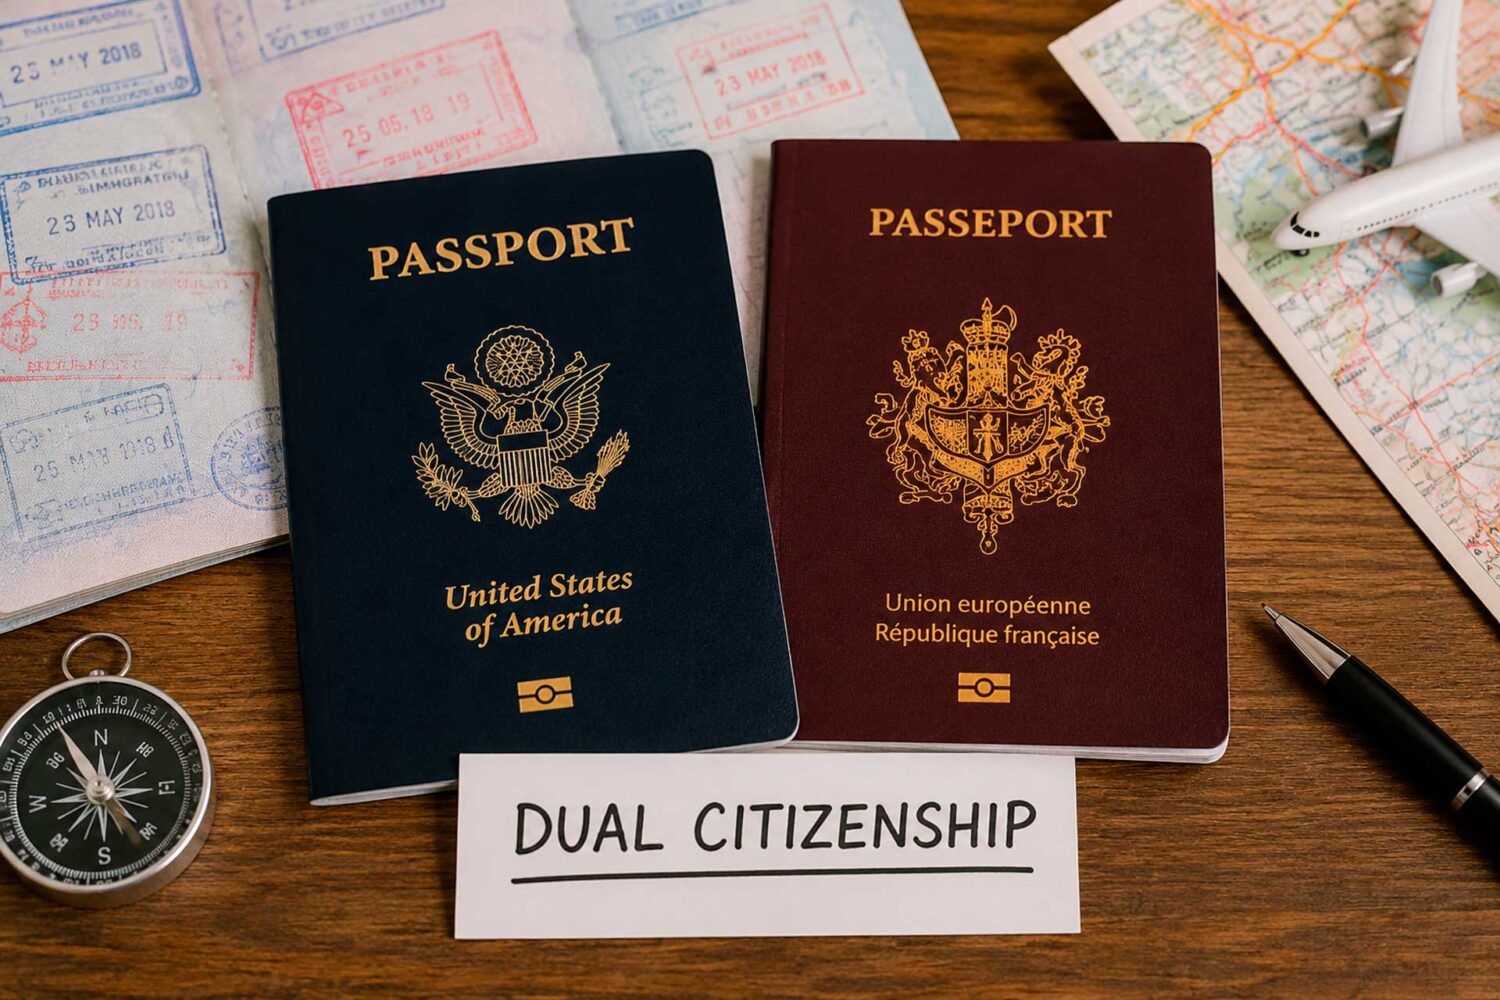


Find out details about obtaining an EU passport at a free consultation
Fill out a simple form and an immigration lawyer will contact you shortly.