


Richest Countries in the World in 2026: Full Rankings by GDP, GDP Per Capita, and GNI
- What Does “Richest Country” Mean in 2026?
- Data Source and Methodology
- Top 10 Richest Countries in 2026 by GDP Per Capita (Nominal)
- Why Small Countries Dominate These Rankings
- Richest Countries by Alternative Measures
- Limitations of GDP Per Capita
- What High GDP Per Capita Actually Means for Residents
- Key Takeaways
- Richest Countries to Move to in 2026
The richest countries in the world are not always the largest economies. In 2026, small financial hubs like Luxembourg and Singapore continue to outperform global giants on a per-capita basis, while the United States and China dominate in absolute GDP.
By GDP per capita (nominal) – a key measure of average economic output per person – Luxembourg leads with roughly $154,000 per person, followed by Ireland and Switzerland. Many of the top spots are held by small, high-income economies (often financial hubs or resource-rich states). In contrast, by total GDP, the United States (≈$31.8 trillion) and China (≈$20.7 trillion) are the largest economies.
This article explains these rankings, the data behind them (IMF 2025 projections for 2026), and alternative metrics like GDP (PPP) and GNI per capita. It also explores why tiny countries dominate per-capita rankings and discusses the limitations of GDP per capita as a measure of wealth.
What Does “Richest Country” Mean in 2026?
Defining “Richest”: The term “richest country” can refer to different metrics. It might mean the country with the largest total economy (GDP) or the one with the highest income per person (GDP per capita). Total GDP measures the overall economic output of a nation – by this measure, large economies like the U.S. dominate with tens of trillions in output. However, dividing GDP by population gives GDP per capita, which gauges average prosperity per person. This often paints a different picture – for example, tiny Luxembourg (pop. ~0.65 million) can outrank economic giants in per-person wealth because its economy is disproportionately large for its small population. In essence, “richest” often equals “small” when looking at per-capita figures, since a modest GDP spread over a very small population yields a very high average income per resident.
Nominal vs PPP: GDP per capita can be expressed in nominal terms (using current market exchange rates) or in purchasing power parity (PPP) terms. Nominal GDP per capita (in USD) is a raw figure that doesn’t adjust for cost-of-living differences or inflation – it’s useful for comparing countries’ economic output at market exchange rates. PPP GDP per capita, on the other hand, adjusts for local prices and inflation, essentially asking: How much can you actually buy with that income in each country? PPP is often considered a better indicator of standard of living because it accounts for cheaper or more expensive costs in each country. For example, an income of $50,000 might afford a higher living standard in Portugal than in Switzerland due to price differences. In this article, “richest” will primarily refer to nominal GDP per capita (unless stated otherwise) since it’s a common benchmark for financial wealth, but we will also highlight PPP and other measures for context.
Why GDP Per Capita?: While total GDP shows economic might, it doesn’t tell us how wealthy the average person is. That’s why GDP per capita is often used to identify “rich” countries – it reflects the average economic output (and by proxy, income) per person. It’s not a perfect measure of well-being, but it correlates with factors like living standards and development. A high GDP per capita generally indicates a high-income economy where most citizens (on average) produce and earn more. In 2026, as we’ll see, many of the countries with the highest GDP per capita are small, developed nations with advanced industries or abundant natural resources.
(Note: “GDP per capita” here refers to nominal GDP per capita in current U.S. dollars, unless otherwise specified. All figures for 2026 are projections from the latest IMF data.)
Data Source and Methodology
IMF WEO 2025 Projections: The rankings and figures in this article are based on data from the International Monetary Fund’s World Economic Outlook (WEO), October 2025 edition, which provides projections for 2026. This is one of the most authoritative sources for global economic forecasts. We use the IMF’s 2026 projected GDP and GDP per capita (nominal) for each country. All GDP figures are in U.S. dollars at current prices (nominal terms). By using a single reputable source (the IMF), we ensure consistency in methodology across countries.
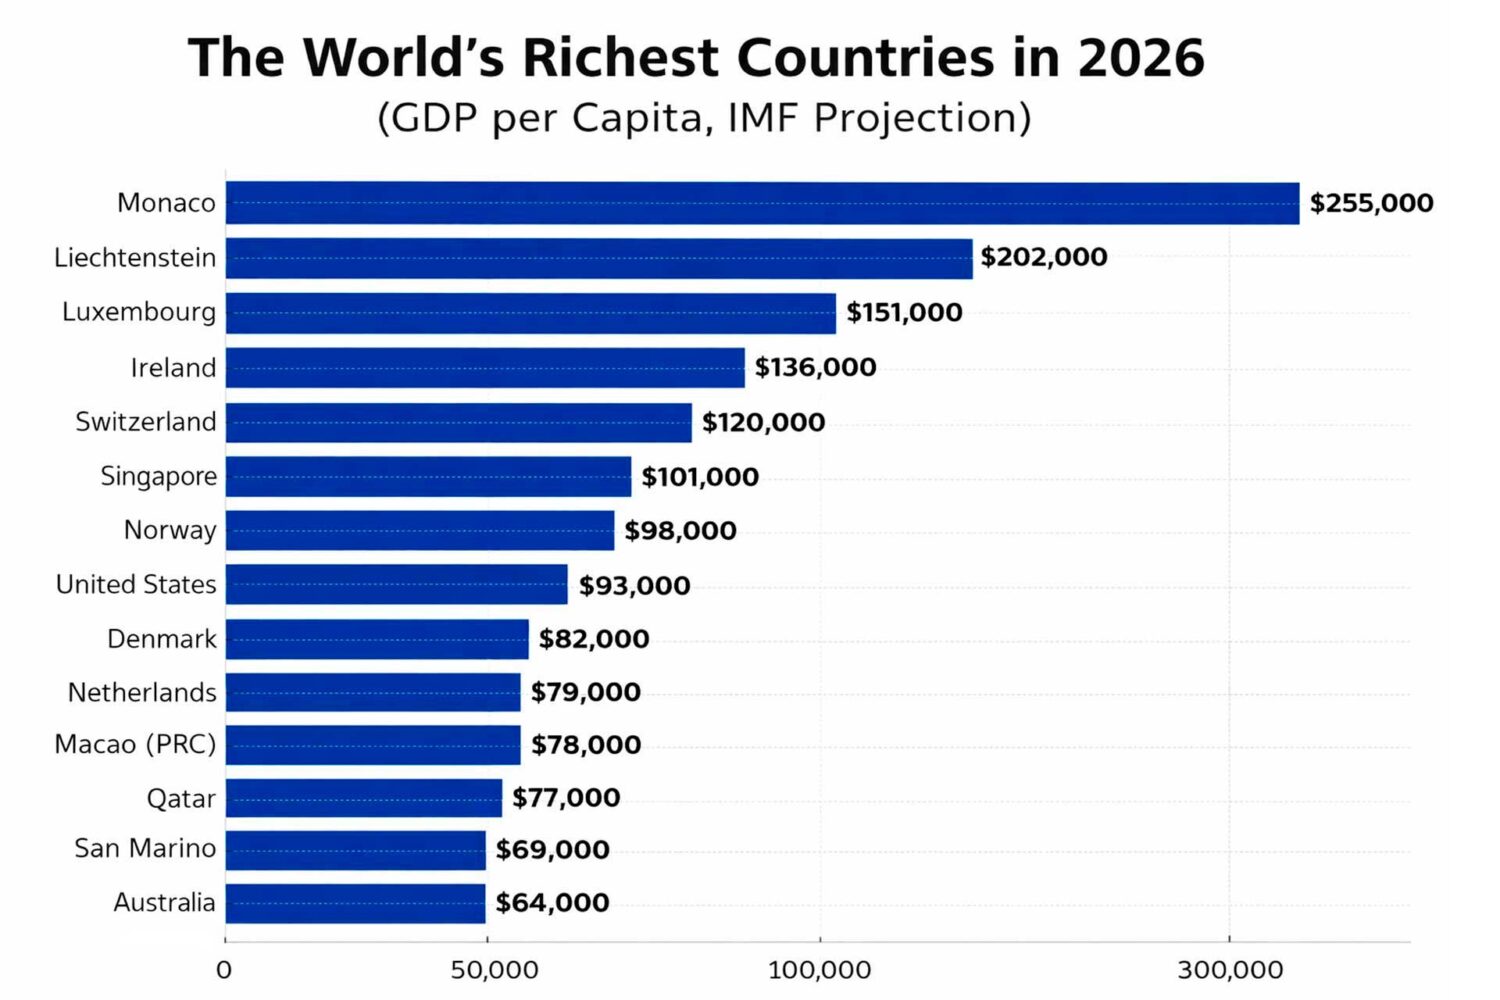
Inclusion Criteria: We focus on sovereign countries as listed in the IMF dataset. The IMF covers most economies, including some small states and territories. However, a few ultra-small economies often cited as “richest” are not IMF members or lack official IMF data – for example, Monaco (a city-state known for its wealthy residents) is not in the IMF database. In such cases, other sources (like World Bank data) estimate Monaco’s GDP per capita at over $250,000, which would make it the world’s richest entity per person. Likewise, Bermuda and the Cayman Islands (UK territories) have very high incomes but rely on World Bank or UN data. In our main rankings, we will note such places where relevant, but the primary top-10 list uses IMF-projected data for 2026.
GDP vs GNI: It’s worth noting that GDP (Gross Domestic Product) measures the output within a country’s borders, whereas GNI (Gross National Income) measures the income of a country’s residents and businesses, including returns on investments abroad (and excluding profits sent out of the country). For most large economies, GDP and GNI per capita are similar. But for certain small economies where multinational companies play a big role (e.g. Ireland or Luxembourg), GNI per capita can be much lower than GDP per capita because a lot of the “product” in GDP is generated by foreign firms and ultimately flows out. We will discuss this in the Limitations section and also present GNI-based rankings in an later section.
Key Terms: All monetary values are in USD. “Per capita” means per person. “Atlas method” refers to the World Bank’s method of averaging exchange rates for GNI calculations to smooth out volatility. “PPP (international dollars)” refers to a hypothetical currency that adjusts for price level differences.
Now, let’s dive into the rankings, starting with the top 10 countries by GDP per capita in 2026.
Top 10 Richest Countries in 2026 by GDP Per Capita (Nominal)
According to IMF projections for 2026, the following are the top 10 countries by nominal GDP per capita (in USD). Each entry includes the estimated GDP per capita and a key driver of that country’s wealth:
| Rank | Country | GDP Per Capita (2026) | Key Driver of Wealth |
|---|---|---|---|
| 1. | Liechtenstein | ~$246,700 | Finance & high-tech manufacturing |
| 2. | Luxembourg | ~$154,100 | Global financial center (banking, investment funds) |
| 3. | Ireland | ~$135,200 | Tech & pharma multinationals (FDI-driven growth) |
| 4. | Switzerland | ~$118,200 | Banking, investment, and high-value industries |
| 5. | Iceland | ~$108,600 | Small population, energy (renewables) & tourism |
| 6. | Singapore | ~$99,000 | Finance and trade hub (global commerce) |
| 7. | Norway | ~$96,600 | Oil & gas resources (energy wealth) |
| 8. | United States | ~$92,900 | Diversified high-productivity economy (tech, finance, etc.) |
| 9. | Denmark | ~$82,700 | High-tech industries and services, equitable economy |
| 10. | Netherlands | ~$77,900 | Trade and finance (major logistics & commerce hub) |
Source: IMF WEO Oct 2025 projections for 2026. Figures rounded to nearest hundred. Key drivers are generalized.
As shown above, tiny countries dominate the top of the list. Liechtenstein – a microstate of under 40,000 people – tops the ranking with an astonishing ~$246k per capita. It achieves this through a mix of wealth management (finance) and high-end manufacturing, all generated by a very small population. Luxembourg (pop. ~645k) comes next at ~$154k per person, thanks to its outsized financial sector and investment-friendly policies. Ireland (~$135k per capita) stands out as a larger country in the top 5; its high GDP per person is driven by foreign multinationals – tech, pharmaceutical, and finance companies whose European headquarters in Ireland produce large outputs (though, as we’ll discuss, not all that income stays in Ireland’s economy). Rounding out the top five, Switzerland (~$118k) leverages its famed banking industry and high-value manufacturing (pharmaceuticals, precision instruments), and Iceland (~$109k) benefits from a small populace with significant revenue from energy and tourism.
Entries 6–10 include global financial hub Singapore (~$99k), oil-rich Norway (~$96.6k), the United States (~$92.9k, which despite its huge economy only recently entered the per-capita top 10 due to its large population), and two highly developed European economies – Denmark and the Netherlands, both around ~$80k. Notably, if we were to include non-sovereign territories, places like Monaco, Bermuda, and the Cayman Islands would appear in the top ten as well (Monaco’s GDP per capita is estimated over $250k, and Bermuda and Cayman around $130k-$140k). However, those are special cases – Monaco’s wealth is concentrated among a tiny elite in a city-state known for tax-free living, and Bermuda/Cayman are offshore financial centers. The list above focuses on countries with available IMF data.
Key takeaway: In 2026, the richest countries by average income are predominantly small, advanced economies – often with significant financial industries or natural resources – rather than the countries with the largest total GDP. Next, we’ll explore why these small nations dominate and then look at alternative ways to measure “richest” countries.
Why Small Countries Dominate These Rankings
Many of the wealthiest countries per capita are indeed small in population. Here are the main reasons why these small countries dominate the GDP per capita rankings:
- Disproportionately Large GDP vs. Small Population: A common factor is a small population dividing into a relatively large GDP. With fewer people, even a modest total GDP can translate into a very high per-person figure. For instance, Luxembourg’s economy (~$100 billion GDP) is tiny in absolute terms, but spread over only ~0.6 million people it yields the highest per capita output in the world. In short, a “rich” country in per-capita terms is often a country that is economically big for its size.
- Financial Centers and Tax Havens: Several top-performer countries are financial hubs that attract wealth and corporations with favorable tax and regulatory regimes. Examples include Luxembourg, Liechtenstein, Singapore, and formerly Bermuda or Cayman (for territories). These nations often host outsized banking sectors, investment funds, or corporate offices that generate huge GDP relative to their population. Luxembourg, for example, manages trillions in investment funds, and Singapore is a banking and trade center for Asia – this drives up GDP per capita as these services earn money from global clients.
- Natural Resource Wealth with Low Populations: Another route to the top is rich natural resources (like oil and gas) in a country with few inhabitants. Norway (oil wealth in a nation of 5.5 million) and Qatar (natural gas riches for ~3 million people) exemplify this. The substantial revenue from hydrocarbons divided by a small citizenry yields very high per-person GDP. (Brunei, not in the top 10 but often cited, similarly has oil wealth for ~440k people.)
- Specialized High-Value Industries: Some small economies carve out niches in high-value industries. For example, Switzerland (pop ~8.7 million) isn’t that small, but it punches above its weight with high-end manufacturing (luxury goods, pharmaceuticals) and finance. Ireland leveraged tech and pharma FDI to boost output. Iceland capitalizes on abundant renewable energy (cheap electricity for aluminum smelting and crypto mining) and tourism, which for ~380k people yields a high average income.
- Tourism and Unique Economies: A few small jurisdictions thrive on tourism or unique gaming industries. Macao SAR (population ~680k) is one of the richest places by GDP per capita thanks to its massive casino tourism industry – even after pandemic setbacks, Macao remains extraordinarily affluent. Similarly, island financial-tourism hybrids like Bermuda have high GDP per cap. These cases show that even if a large portion of GDP comes from visitors or foreign businesses, it still boosts the per capita figure for the local population.
In summary, size matters – small countries can dominate per capita rankings by concentrating wealth, whether through finance, resources, or specialized industries. Of course, this raises questions about sustainability and whether the average resident truly enjoys that prosperity (issues we’ll discuss under limitations). Next, let’s consider alternative ways to define “richest country” beyond just nominal GDP per capita.
If you’re considering relocating to a high-income country for better opportunities and quality of life, it’s important to choose the right pathway from the start. Leave a request for a consultation to explore the best immigration options tailored to your goals.
Schedule a free consultation and get detailed information from Unioncitizenship lawyers. Start the process today!

Richest Countries by Alternative Measures
While GDP per capita (nominal) is a popular yardstick, it’s not the only way to assess a country’s wealth. Here we provide a brief look at three alternative measures and which countries top those lists.
By GDP Per Capita (PPP)
If we adjust for purchasing power parity (PPP), we get a sense of which countries’ residents can buy the most goods and services with their income, leveling differences in cost of living. Using GDP per capita (PPP) in constant international dollars (IMF 2026 projections):
- Singapore and Luxembourg are neck-and-neck for the top spot. In fact, IMF data suggests Singapore’s PPP-adjusted GDP per capita is around $156,000, slightly surpassing Luxembourg’s ~$153,000. These two, along with Ireland (in the ~$130k+ PPP range), lead the world when standardizing for local prices.
- Qatar and Macao also rank extremely high by PPP. Qatar’s GDP per capita jumps to roughly $121,000 in PPP terms (versus ~$76k nominal), reflecting that many goods/services are cheaper in Qatar, so its petrodollar income stretches further domestically. Macao’s PPP value likewise stays above $130k. Other Gulf states like United Arab Emirates and Kuwait also climb higher on a PPP basis (their PPP per capita often exceeds $70k, higher than many Western countries).
- The United States and Norway remain in the top 10 in PPP, similar to nominal, but countries like Brunei and Saudi Arabia rank higher in PPP than in nominal terms, due to lower living costs.
In summary, wealthy small countries still dominate PPP rankings, but resource-rich economies gain ground. PPP per capita is a better indicator of typical living standard – e.g., an income in Switzerland (high cost) doesn’t go as far as the same income in Qatar or Singapore (lower relative costs), so PPP “equalizes” that. For instance, while Switzerland’s nominal GDP per cap is ~$118k, its PPP per cap is around $91k, whereas Ireland’s nominal $135k becomes about $100k PPP – a bit lower due to Ireland’s relatively high prices.
By Total GDP (Nominal)
If by “richest” we mean sheer economic size (total GDP), the ranking looks entirely different – big population countries lead. Based on nominal GDP in 2026 (IMF projections):
- The United States is the world’s richest country in absolute terms, with a projected GDP around $31.8 trillion. The U.S. economy by itself makes up roughly a quarter of global GDP. It’s a diversified colossus, from technology to finance to consumer markets.
- China is second, at approximately $20.7 trillion GDP. While China’s GDP per person is much lower than that of small rich nations (due to 1.4+ billion population), its total output is enormous and still growing. The U.S. and China together account for an outsized share of world output.
- Far behind those two, Germany is projected around $5.3 trillion in 2026, making it a distant third. India has around $4.5 trillion, likely overtaking Japan (≈$4.46 trillion) by this time as the fourth-largest economy. These rankings can shift with exchange rates and growth rates – India’s rapid growth is closing the gap with Japan.
- Completing the top ten by total GDP: #5 Japan (~$4.46T), #6 United Kingdom (~$4.23T), #7 France (~$3.56T), #8 Italy (~$2.70T), #9 Russia (~$2.51T) and #10 Canada (~$2.42T). Economies like Brazil, South Korea, Australia follow closely behind in the $1.5–2.3T range.
In essence, the richest countries by total GDP are the world’s largest economies – which correlates strongly with population and industrial output. These are the powerhouses of global economic activity (even if their wealth per person varies widely). It’s a reminder that countries like China or India, despite lower per capita income, are critical when discussing global wealth because of their scale.
By GNI Per Capita (Atlas Method)
Gross National Income per capita (GNI per capita) is the metric the World Bank uses to classify countries by income level. It is similar to GDP per capita but adjusts for income that actually stays with residents. The Atlas method further smooths exchange rate fluctuations by averaging rates over three years. According to the latest World Bank Atlas GNI data (circa 2024, which we use as a proxy for 2026 rankings):
- Norway emerges as one of the top countries by GNI per capita, with about $98,300 (Atlas method) per person. This reflects Norway’s oil income distributed among a population of 5.5 million, and importantly Norway’s GNI is close to its GDP (little foreign profit outflow – oil revenues largely benefit the national economy).
- Switzerland is next at roughly $95,900 GNI per capita, and Luxembourg around $91,500. These are slightly lower than their GDP per capita figures, indicating some net income outflow (especially in Luxembourg’s case, where many cross-border workers contribute to GDP but send income abroad).
- The United States has about $83,600 GNI per capita by the Atlas method, reflecting its high national income. Other high-GNI countries include Iceland (~$78,500), Denmark (~$73,800), Netherlands (~$62,800) among others. These values underscore that many advanced economies cluster with GNI per capita in the tens of thousands.
- A notable difference is Ireland: Its GNI per capita (Atlas) is only around $77,900, which is drastically lower than Ireland’s $100k+ GDP per capita. This gap arises because much of Ireland’s GDP is generated by foreign companies (tech, pharma) and a significant portion of profits is repatriated or attributed to foreign shareholders. In fact, Ireland’s GDP has been as high as 140–150% of its modified GNI (GNI*) in recent years. GNI per capita thus provides a more realistic picture for such cases, indicating Ireland’s domestically accruing income is far less “rich” than its GDP figures suggest.
- It’s also worth noting some small financial havens have high GNI per capita: for example, Bermuda (a UK territory) tops the world with about $140k GNI per cap, due to its wealth management sector – but again, not a sovereign country. Among sovereigns, oil nations like Qatar (GNI ~$76.7k) and rich Asian city-states like Singapore (~$74.8k) are high on GNI as well.
In summary, GNI per capita generally aligns with GDP per capita for many countries, but in cases of distortions (tax havens, profit shifting), GNI is lower and arguably more indicative of the income available to the population. Norway, Switzerland, Luxembourg, and the U.S. appear as truly high-income nations by GNI, whereas places like Ireland or Luxembourg show somewhat reduced figures once adjusted. GNI per capita is a useful complementary measure to identify if a country’s GDP is inflated by foreign enterprises.
(For reference, as of mid-2020s the World Bank uses GNI per capita (Atlas) to classify high-income countries. The threshold for “high-income” is around $13,000 GNI per cap, which all countries discussed here far exceed.)

Limitations of GDP Per Capita
GDP per capita is a handy metric for comparing average economic prosperity, but it has important limitations and caveats to keep in mind:
- It’s an Average – Inequality Matters: GDP per capita tells us the mean income/output per person, not how wealth is distributed. A country could have a high per-capita GDP but very unequal income distribution, meaning the typical resident might not be “rich.” As Global Finance notes, these figures deal with averages, and within each country, wealth can be concentrated among those already advantaged. For example, the United States has one of the highest GDP per capitas, but also significant inequality – the averages are boosted by very high incomes at the top. Conversely, some countries with lower GDP per capita might have more equitable distribution. Thus, GDP per capita ≠ average person’s income in practical terms; it’s just an average. Complementary indicators like median income or poverty rates are needed to gauge typical living standards.
- Cost of Living Differences: Using nominal GDP per capita (as we did in the main ranking) doesn’t account for how expensive or cheap it is to live in a country. $50k in one country might afford a luxurious life, while in another it’s barely middle-class. That’s why PPP-adjusted measures exist – to consider price levels. If one ignores PPP, countries with very high costs (like Switzerland or Norway) might seem richer than they feel, and countries with lower costs (like some Gulf states) might have a better actual standard of living than nominal figures imply. Our section on PPP addressed this, and generally PPP per capita is better for comparing standard of living.
- Tax Haven and Corporate Distortions: A number of countries at the top of the GDP per capita list are tax havens or corporate havens. Their GDP includes huge profits of foreign companies that book income there for tax advantages, inflating local GDP relative to the actual domestic economy. The IMF has repeatedly cautioned that GDP figures for such jurisdictions should “be taken with a grain of salt”, as much of the wealth was generated elsewhere. Ireland is the poster child of this effect: its attraction of multinational tech and pharma firms through low taxes swells its GDP. In 2015, Irish GDP was 143% of Ireland’s modified GNI* (GNI* strips out multinationals’ tax-driven distortions). In other words, nearly 30% of what shows up in Ireland’s GDP that year was not actually benefiting Ireland’s residents proportionately. This led Ireland’s central bank to introduce GNI* as a better gauge for their economy. Other examples include Luxembourg (many foreign firms and cross-border workers), and island financial centers (where GDP includes corporate registrations with little local activity). For these countries, GDP per capita overstates the income of the local population – GNI or adjusted metrics give a lower, more realistic number.
- GDP vs GNI – Who Gets the Money: As discussed, GDP counts all output within a country’s borders, even if the profits belong to foreign entities. GNI counts what nationals earn. In countries with large foreign investment or foreign labor, GDP per capita can be much higher than GNI per capita. For example, Luxembourg’s official GDP per cap is around $154k, but a lot of that is generated by cross-border workers commuting in; Luxembourg’s GNI per cap is lower (~$91k) because a chunk of income leaves the country. Ireland’s case we already mentioned (GNI far less than GDP). Conversely, some countries have GNI > GDP if they earn lots of money abroad (e.g., countries with many citizens working overseas sending money back, or heavy foreign investments). Thus, GDP per capita can mislead if one doesn’t consider these flows – it’s not always equal to average national income.
- Non-Monetary Factors Ignored: GDP per capita doesn’t measure well-being directly. It ignores important aspects like quality of life, health, education, environmental quality, leisure time, etc. A country could boost GDP (and thus per capita) by overworking its population or depleting natural resources, which isn’t sustainable or desirable. It’s purely an economic output measure. So, “richest” by GDP per capita doesn’t necessarily mean “best place to live” or highest human development (though high GDP per cap often correlates with high HDI in practice, since rich countries can invest in healthcare, education, etc.). Additionally, underground economy and non-market activities (home caregiving, subsistence farming) aren’t captured, which in poorer nations means GDP per cap might understate actual living conditions to some extent.
In summary, GDP per capita is a useful but imperfect metric. It provides a quick comparison of economic output per person, and in 2026 it clearly highlights the success of certain small economies. However, one should be aware of its quirks: it’s an average (masking inequality), may be inflated by foreign capital in tax havens, and doesn’t directly show how comfortably people live (that’s where PPP and social indicators come in). For a full picture of a country’s “richness,” economists look at GDP (total size), GDP per capita (average output), GNI per capita (average income), and other indicators like median income, poverty rate, and human development.
What High GDP Per Capita Actually Means for Residents
A high GDP per capita does not automatically mean that everyone in a country is wealthy. In practice, it usually signals that the economy generates high levels of income and productivity, but everyday living standards depend on several additional factors — especially salaries, taxation, housing costs, purchasing power, and inequality. Countries such as Luxembourg, Switzerland, Singapore, and Norway consistently rank near the top globally in GDP per capita, yet the real experience of residents can differ significantly.
One of the clearest advantages of high-income economies is salary potential. Switzerland, Luxembourg, and the United States combine high GDP per capita with strong average wages and purchasing power. Numbeo’s 2026 Purchasing Power Index shows that countries like Switzerland, Luxembourg, Denmark, and the Netherlands remain among the strongest globally in terms of what residents can actually afford after taxes and living expenses.
At the same time, wealthy countries often have very high taxes. Nordic states such as Denmark and Norway use progressive tax systems to finance universal healthcare, education, infrastructure, and social protection. This means residents may keep a smaller share of gross income, but they also receive extensive public services in return. In contrast, countries such as Singapore or the UAE generally impose lower taxes but rely more heavily on private spending for healthcare, housing, or education.
Housing is another major reality check. Many of the world’s richest countries also have some of the world’s most expensive real-estate markets. Switzerland, Singapore, Ireland, and Luxembourg all face affordability pressures due to limited housing supply and strong international demand. As a result, high salaries do not always translate into easy wealth accumulation, especially for younger residents or new immigrants.
Cost of living also changes the meaning of “rich.” A country may rank extremely high in GDP per capita while everyday expenses — rent, healthcare, childcare, transport, and food — absorb a large share of household income. Purchasing-power rankings are therefore often more useful for comparing real living standards than raw GDP figures alone.
Inequality is another important limitation. Some countries achieve very high GDP per capita because of concentrated financial sectors, multinational corporate activity, or natural-resource wealth, but the benefits are not always distributed evenly across society. Ireland, for example, has unusually high GDP figures partly because of multinational accounting flows, while Gulf economies may show strong national income despite significant income disparities between citizens and migrant workers. This is why economists increasingly compare GDP with indicators such as GNI, median income, and quality-of-life indexes when evaluating how prosperous a country actually feels for ordinary residents.
If you’re considering moving to a high-income country, it’s important to evaluate not just economic statistics, but real living conditions and your personal opportunities. Leave a request for a consultation to get tailored advice on the best destinations and immigration pathways for your goals.
Schedule a free consultation and get detailed information from Unioncitizenship lawyers. Start the process today!

Key Takeaways
Luxembourg (and Other Small Nations) Lead in 2026. By GDP per capita, Luxembourg is the richest country in 2026 at about $154k per person. It exemplifies how small, high-income economies (finance-driven, in this case) dominate per-capita rankings. Other top contenders include Ireland, Switzerland, Singapore, and Norway, all with ~$90k+ per capita incomes.
United States and China Dominate Total GDP. The term “richest country” can also refer to total wealth. In 2026, the U.S. (~$31.8 trillion GDP) and China (~$20.7 trillion) have by far the largest economies. They are the economic superpowers in absolute terms, even though their per-person incomes are lower than those of several smaller countries.
Small Population, High Output = High Per Capita. Many of the richest countries per capita have small populations and specialized economies. Financial hubs (Luxembourg, Singapore), resource-rich states (Norway, Qatar), and tech/tax-attractive economies (Ireland) can generate a large GDP that, when divided among a small number of people, results in very high averages. Small countries punch above their weight in these rankings.
GDP per Capita vs PPP and GNI. To fully gauge “richness,” consider alternative metrics. GDP per capita (PPP) adjusts for living costs – by this measure, countries like Singapore, Luxembourg, and Qatar rank extremely high, underscoring their true purchasing power. GNI per capita accounts for income that actually stays in a country – by GNI, Norway and Switzerland top the charts around ~$95k due to their genuine national incomes, whereas a country like Ireland falls lower once foreign profits are excluded. Each metric offers a different perspective on wealth.
Beware of Averages and Distortions. A high GDP per capita doesn’t guarantee a high standard of living for everyone. It’s an average – affluent countries can still have poverty or inequality (the wealth might be concentrated). Moreover, some GDP figures are inflated by foreign corporate activity (e.g., Ireland, Luxembourg), meaning they don’t reflect all locally-earned income. Analysts use tools like PPP adjustments or modified GNI to get a clearer picture in such cases.
Richest ≠ Best Quality of Life (Necessarily). While generally high-income countries also score well on quality of life and development indices, there are other factors (healthcare, education, environmental quality, social equality) that define well-being. GDP/GNI per capita is a strong indicator of material wealth and capacity, but it should be viewed alongside human development indicators for a complete assessment of a country’s prosperity.
By understanding these distinctions, one can appreciate that “richest country in the world” is not a one-dimensional label – it varies by definition and comes with context. The year 2026 continues to see a familiar pattern: tiny economies sitting atop per-capita wealth rankings, and the major world powers leading in aggregate GDP. Each measure tells a story about how wealth is generated and distributed across the globe.
Richest Countries to Move to in 2026
For relocation, the “richest” country is not always the best choice. A strong destination should combine high income potential with realistic residence options, reliable healthcare, manageable taxation, and strong quality of life. IMF data shows that countries such as Luxembourg, Switzerland, Singapore, Norway, and the United States remain among the world’s high-income economies, but the everyday experience of residents depends heavily on costs, tax rules, housing, and access to services.
| Country | Residence options | Taxes | Healthcare | Quality of life |
|---|---|---|---|---|
| Switzerland | Work permits and residence permits tied to employment; foreign workers usually need a valid job contract and local registration | Moderate to high, depending on canton | High-quality but insurance-based and expensive | Very high salaries, safety, stability, but costly housing |
| Luxembourg | Work, business, study, and family residence routes | Relatively high but supported by strong public services | Strong public healthcare system | One of the strongest quality-of-life profiles in Europe |
| Singapore | Employment Pass, EntrePass, investor and family routes | Comparatively low personal taxes | Excellent healthcare, but partly private-cost based | Very safe, business-friendly, efficient, but expensive |
| Norway | Skilled worker, family, study, and business-related residence routes | High taxes | Universal healthcare funded through public systems | High wages, safety, nature, social protection |
| United States | Employment visas, family immigration, investor routes, green card pathways | Varies widely by state and income | Advanced but expensive and insurance-driven | High income potential, innovation, career opportunities |
| UAE | Employment residence, Golden Visa, investor and business routes | Low or no personal income tax in many cases | Strong private healthcare sector | High safety, tax advantages, expat-friendly cities |
Switzerland is one of the strongest choices for high earners, especially in finance, pharma, technology, and international organizations. However, residence is closely tied to employment and local registration, and the cost of living is among the highest in the world. Swiss authorities state that foreign workers generally need a valid employment contract and must register for a residence permit after arrival.
Luxembourg is attractive for EU-focused professionals because it combines high GDP per capita, strong purchasing power, multilingual labor markets, and high quality of life. It is especially relevant for finance, EU institutions, legal services, and cross-border business. Numbeo’s quality-of-life rankings also place several wealthy European countries, including Luxembourg and Switzerland, near the top for overall livability.
Singapore and the UAE stand out for business owners and globally mobile professionals because of their tax efficiency and international business infrastructure. The tradeoff is that healthcare, schooling, and housing can be expensive, especially for families without strong employer support.
Norway is less tax-light, but it offers a different kind of wealth: strong public services, social stability, healthcare access, and long-term family security. OECD healthcare data shows why wealthy countries should not be judged only by income, since health-system performance and access are major parts of real living standards.
For migration planning, the best “rich country” is usually not the one with the highest GDP per capita on paper. It is the country where your residence pathway, tax position, healthcare access, family needs, and career prospects actually align. If you’re thinking about relocating to a wealthier country, it’s important to look beyond rankings and choose the option that fits your goals and lifestyle. Leave a request for a consultation to explore the best immigration pathways and make an informed decision.



Find out details about obtaining an EU passport at a free consultation
Fill out a simple form and an immigration lawyer will contact you shortly.