Happiest Countries in the World 2026
- Top Happiest Countries
- Key Indicators and Methodology
- Why These Countries Rank High
- Trends Changes and Criticisms
- How to Interpret the Rankings
- Expert Tips
The “happiest countries” ranking is the annual global league table published in the World Happiness Report. It uses nationally representative Gallup World Poll responses and asks adults to evaluate their lives on a scale from 0 to 10, from the worst possible life to the best possible life. The latest 2026 edition is based on the 2023–2025 period for the main ranking.
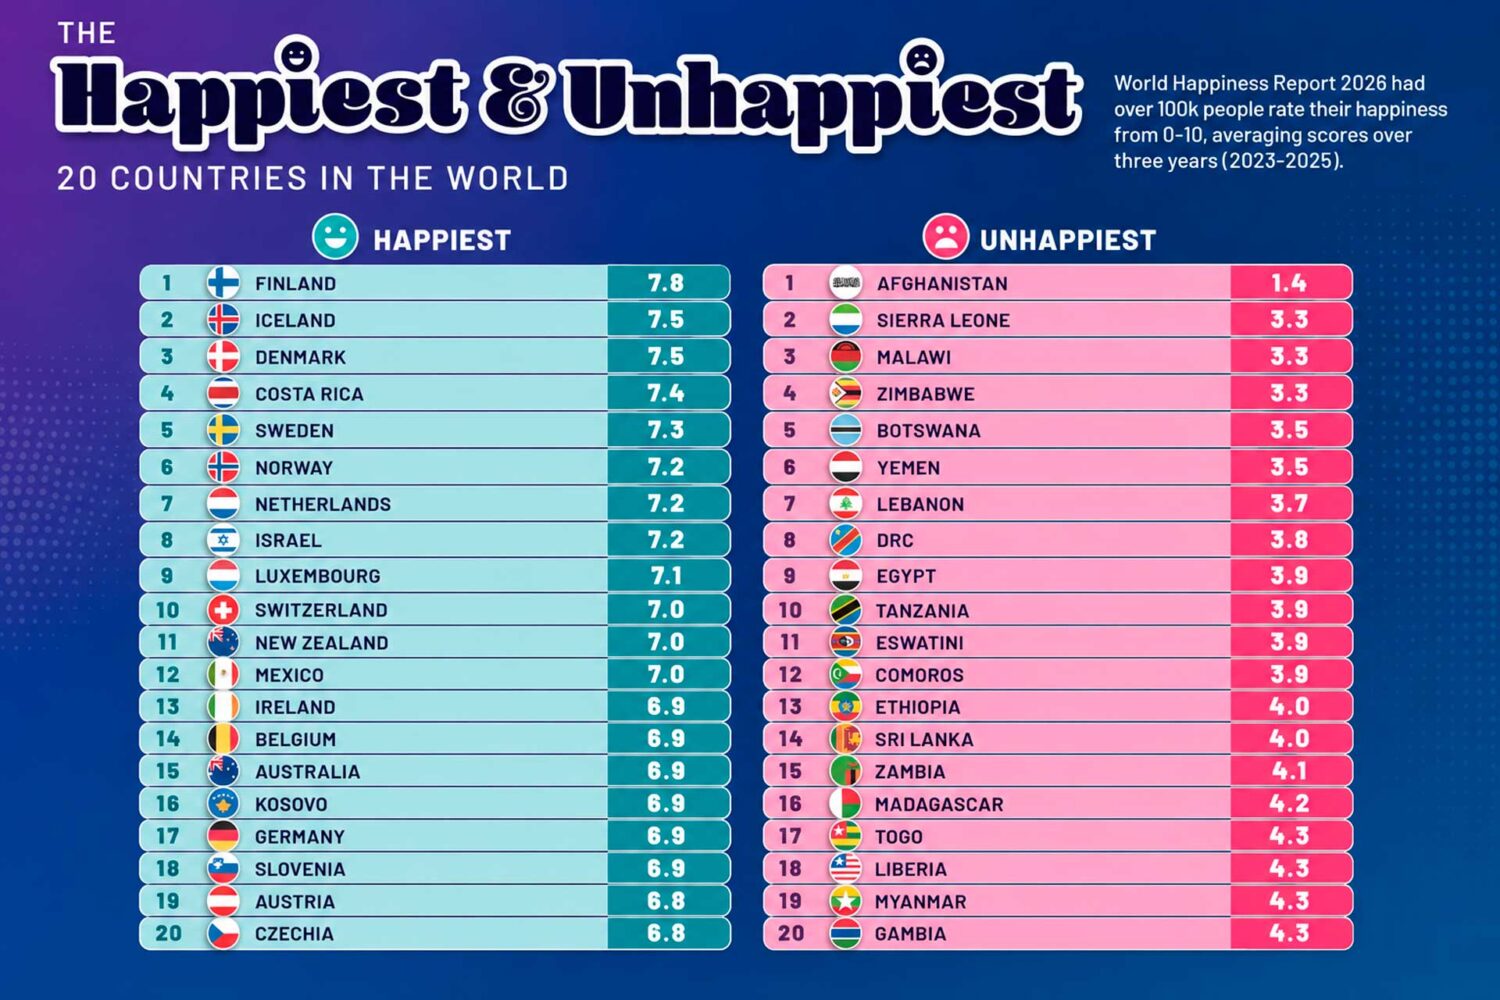
The ranking includes more than 140 countries and territories. In the 2026 results, the top score is Finland’s 7.764, while the global country-year mean for 2023–2025 in the statistical appendix is 5.67. The top-20 cutoff is 6.821, the same score shared by Czechia at rank 20 and the United Arab Emirates at rank 21, though published rank ordering and confidence intervals still matter.
Who is “included” depends on data availability. The report’s ranking uses life-evaluation responses from Gallup. However, some of the six explanatory factors are unavailable or only partly available for some places, which is why a country can appear in the happiness ranking even if one or more decomposition values are missing in the appendix figures.
The broad patterns are stable: Nordic countries still dominate, Costa Rica is the headline mover, and several Central and Eastern European countries now sit in the top 20. At the same time, many Western industrial countries are less happy than they were in the late 2000s, and youth wellbeing has weakened especially in North America, Australia, and New Zealand, and Western Europe.
Top Happiest Countries
The current image is a visual summary of the 2026 global distribution. The analysis and table that follow rely on the official World Happiness Report 2026 ranking figures and statistical appendix rather than on the infographic alone.
| Rank | Country | Score | GDP per capita | Healthy life expectancy | Social support | Freedom score | Giving rate |
|---|---|---|---|---|---|---|---|
| 1 | Finland | 7.764 | 56,054 | 69.93 | 0.949 | 0.943 | 0.383 |
| 2 | Iceland | 7.540 | 67,773 | 71.37 | 0.978 | 0.943 | 0.676 |
| 3 | Denmark | 7.539 | 71,177 | 70.06 | 0.947 | 0.927 | 0.495 |
| 4 | Costa Rica | 7.439 | 26,971 | 67.63 | 0.894 | 0.941 | 0.231 |
| 5 | Sweden | 7.255 | 63,136 | 71.12 | 0.925 | 0.921 | 0.556 |
| 6 | Norway | 7.242 | 90,539 | 71.16 | 0.945 | 0.935 | 0.605 |
| 7 | Netherlands | 7.223 | 70,645 | 69.97 | 0.914 | 0.875 | 0.639 |
| 8 | Israel | 7.187 | 47,726 | 70.76 | 0.938 | 0.786 | 0.505 |
| 9 | Luxembourg | 7.063 | 128,717 | 71.23 | 0.888 | 0.911 | 0.494 |
| 10 | Switzerland | 7.018 | 82,217 | 71.15 | 0.912 | 0.898 | 0.572 |
| 11 | New Zealand | 6.995 | 49,213 | 69.98 | 0.928 | 0.897 | 0.558 |
| 12 | Mexico | 6.972 | 21,989 | 61.44 | 0.852 | 0.885 | 0.217 |
| 13 | Ireland | 6.928 | 122,023 | 70.00 | 0.921 | 0.896 | 0.671 |
| 14 | Belgium | 6.926 | 63,345 | 69.79 | 0.907 | 0.869 | 0.432 |
| 15 | Australia | 6.916 | 60,386 | 70.61 | 0.899 | 0.868 | 0.582 |
| 16 | Kosovo | 6.910 | 15,656 | n/a | 0.827 | 0.905 | 0.568 |
| 17 | Germany | 6.882 | 62,711 | 68.93 | 0.896 | 0.841 | 0.543 |
| 18 | Slovenia | 6.868 | 48,524 | 69.36 | 0.933 | 0.938 | 0.416 |
| 19 | Austria | 6.845 | 63,991 | 69.79 | 0.891 | 0.862 | 0.621 |
| 20 | Czechia | 6.821 | 48,155 | 66.66 | 0.933 | 0.904 | 0.411 |
Ranked list with short profiles
- Finland remains the clear outlier at the top: extremely strong social support and freedom, high healthy life expectancy, and among the lowest corruption-perception scores in the appendix figures.
- Iceland pairs the world’s highest social-support score with elite health and freedom metrics, which helps explain why it stays near Finland.
- Denmark combines high income, high support, high freedom, and strong giving, which is exactly the kind of balanced profile that does well in happiness research.
- Costa Rica is the strongest “money is not everything” case in the top tier: its GDP is far below the Nordic leaders, but freedom is extremely high and positive affect is also strong.
- Sweden stays in the global top five with strong health, social support, and freedom, even if it no longer sits at the absolute top of the table.
- Norway remains one of the strongest all-rounders in the dataset, especially on income, health, support, and freedom.
- The Netherlands stands out for high income and a strikingly strong giving rate, even though its freedom score is lower than the Nordic leaders.
- Israel ranks unusually high given regional insecurity, supported by very strong social support and excellent healthy life expectancy, though its freedom score in the appendix figures is weaker than other top-10 countries.
- Luxembourg is the income powerhouse of the top 10, but its social-support score is less exceptional than the Nordics.
- Switzerland posts elite income and health outcomes, reinforcing the idea that both material and social conditions matter when stress is lower and institutions are trusted.
- New Zealand mixes strong support and giving with high life evaluation, though the broader English-speaking trend on youth wellbeing has been negative.
- Mexico is another reminder that happiness rankings are not simply GDP rankings: income and health are relatively modest, but freedom and positive affect are high enough to push it into the top 12.
- Ireland benefits from very high GDP per capita, strong support, healthy life expectancy, and one of the strongest giving rates among the top 20.
- Belgium earns its place through balance rather than one overwhelming strength: good income, good health, good support, and no major weakness except middling generosity.
- Australia still scores highly, supported by high income, health, and giving, but it no longer sits comfortably in the top 10 as it once did.
- Kosovo is a major overperformer relative to income: its GDP is low by top-20 standards, but freedom and giving are strong. Some official decomposition data remain unavailable in the public appendix figures.
- Germany remains prosperous and socially supported, but its freedom score is weaker than that of several peers above it.
- Slovenia is one of the most interesting Central European cases: very strong support and freedom, improving long-term happiness, and a stable place in today’s top 20.
- Austria pairs high income and strong giving with high health, but it has slipped from the absolute top tier it occupied earlier in the last decade.
- Czechia closes the top 20 with very strong support and freedom and a now well-established reputation as a Central European happiness success story.
If you want to live in one of the world’s happiest countries, our specialists can help you choose the right immigration pathway and find the best destination for your future. Leave a request for a personal consultation today.
Schedule a free consultation and get detailed information from Unioncitizenship lawyers. Start the process today!

Key Indicators and Methodology
The World Happiness Report’s ranking is built from one core question: the Cantril Ladder. Respondents are asked to imagine a ladder from 0 to 10, where 10 is the best possible life and 0 is the worst possible life, and then to place themselves on that ladder. The report typically uses around 1,000 responses per country per year and publishes a three-year average for the headline ranking because that improves precision.
The six well-known explanatory variables are defined in the official 2026 statistical appendix. GDP per capita is measured in PPP-adjusted constant 2021 international dollars; 2025 GDP values were extended using OECD and World Bank forecasts because final 2025 values were not yet available as of January 2026. Healthy life expectancy is based on WHO data, available through 2021 and then aligned to the report period using extrapolation or interpolation where needed. Social support is the share answering yes to having friends or relatives to count on. Freedom is the share satisfied with their freedom to choose what to do with their life. Generosity, in the formal decomposition, is a GDP-adjusted residual based on charitable donations. Corruption perception averages views about corruption in government and business.
A crucial methodological point is that the score itself is not constructed from those six factors. They are used to explain cross-country variation, not to mechanically generate the rank order. That is why a country can sometimes outrank a richer place if trust, support, freedom, or emotional-life indicators are stronger.
Close ranks should also be handled carefully. The official methodology publishes 95% confidence intervals, and several countries near each other in the table are statistically close enough that small movements should not be overinterpreted as dramatic social change.
Why These Countries Rank High
The highest-ranked countries usually combine material security with social security. Finland, Iceland, Denmark, Sweden, Norway, the Netherlands, Switzerland, Luxembourg, and Ireland are all strong on some combination of income, health, trust, social support, and public-service capacity. That pattern is also consistent with OECD wellbeing frameworks, which explicitly look beyond GDP toward health, community, environment, civic engagement, safety, and life satisfaction.
One reason the Nordic model stays so visible in global wellbeing debates is trust. The OECD describes public trust as a cornerstone of Finland’s administrative and political model, while Finland’s own statistical system tracks trust in public administration and satisfaction with public services. Trust does not merely make people feel better; a recent meta-analysis also found a robust positive relationship between trust and wellbeing across studies.
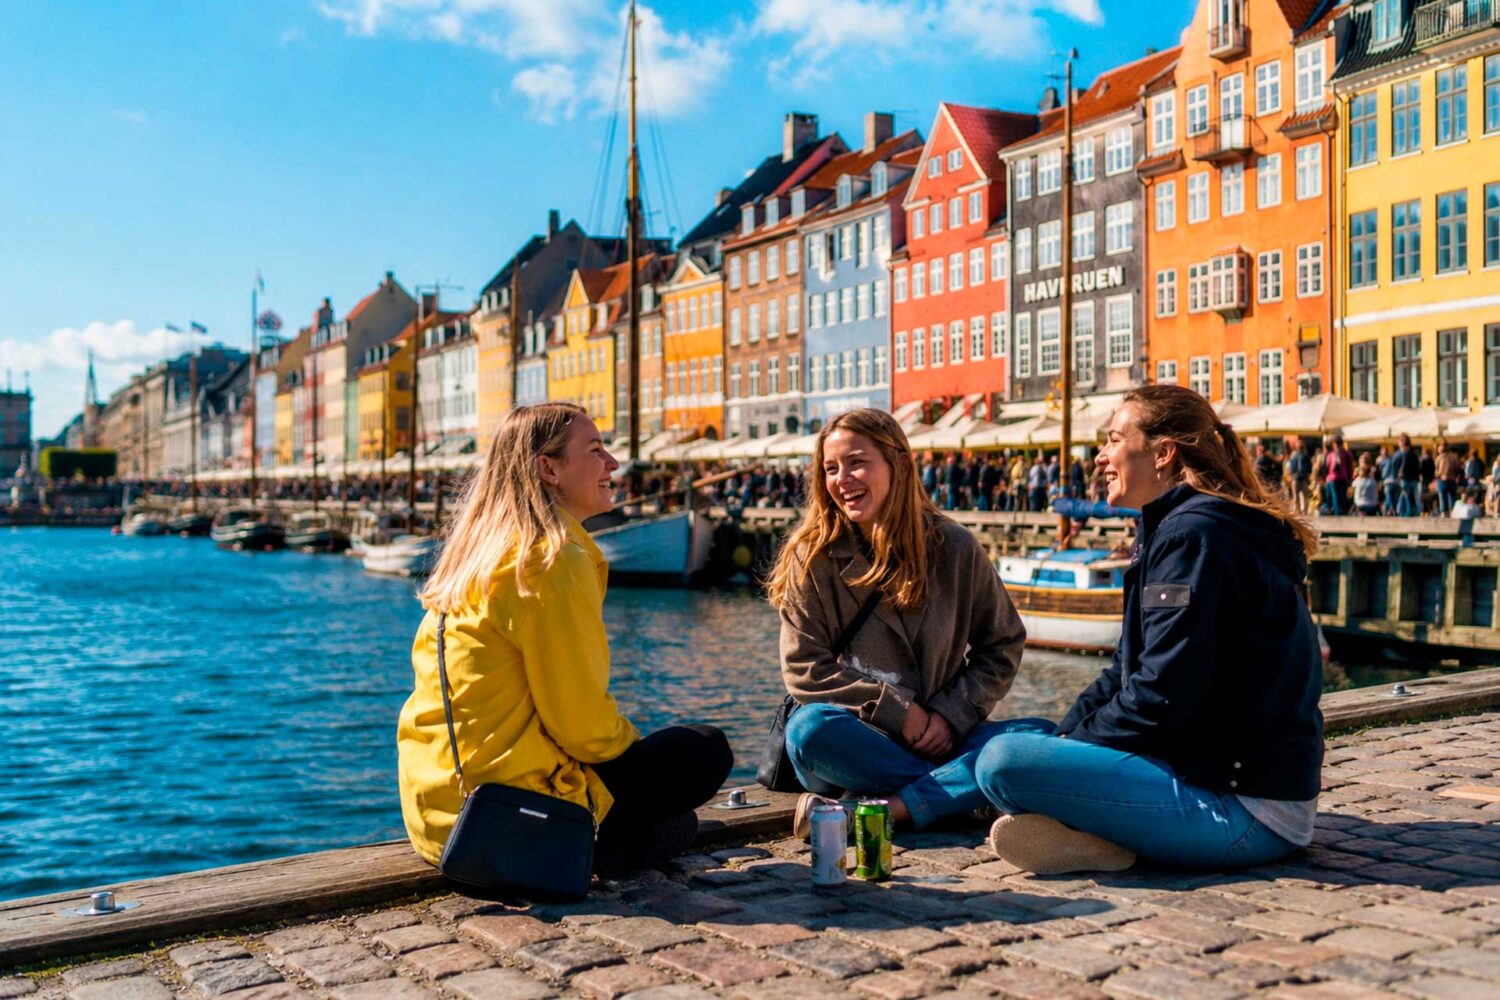
Work-life balance matters as well. Denmark is a good case study: official Denmark materials summarizing OECD wellbeing data note that only about 2% of employees work very long hours, versus an OECD average of 11%, and that Danish full-time workers devote about 66% of their day to personal care and leisure, above the OECD average of 63%. Those are not “soft extras”; they are part of the day-to-day lived experience that makes life feel manageable.
Costa Rica shows that public happiness is not reducible to national wealth. In the 2026 appendix, it ranks only 58th on GDP per capita but 8th on freedom to make life choices, and its positive-affect profile is unusually strong. Mexico tells a similar, though less dramatic, story: comparatively low GDP and healthy life expectancy do not prevent it from ranking 12th because freedom, social life, and emotional experience appear to compensate to a meaningful degree. Peer-reviewed work outside the WHR tradition also supports that broader reading: a 2024 PNAS study found that several Indigenous and local communities with very low cash incomes still reported life satisfaction levels comparable to wealthy societies.
Trends Changes and Criticisms
Recent shifts
The 2026 report shows both continuity and change. Finland has now topped the ranking for the ninth consecutive year. Costa Rica’s rise to fourth is the most attention-grabbing structural change at the top and marks the highest placement ever achieved by a Latin American country. The current top 20 also includes three Central and Eastern European countries — Kosovo, Slovenia, and Czechia — reflecting a longer-term convergence between Eastern and Western European life evaluations.
Longer-term movement is more positive globally than headlines often suggest. Comparing 2023–2025 with the 2006–2010 baseline, the report says 79 of 136 countries recorded significant gains in happiness, versus 41 with significant declines. Many of the largest gains occurred in Central and Eastern Europe, while several of the steepest drops occurred in or near conflict zones.
But richer Western democracies are not uniformly moving upward. The report states that most Western industrial countries are now less happy than they were between 2005 and 2010; 15 posted significant drops, versus only four significant increases. The United States has fallen from 17th in 2013 to 23rd now, Canada from 6th to 25th, Austria from 8th to 19th, and Australia from 10th to 15th.
The youth story is one of the report’s most important findings. For people under 25, the NANZ countries — the United States, Canada, Australia, and New Zealand — now rank between 122 and 133 in changes since the 2006–2010 baseline. The report concludes that youth wellbeing has fallen only in the NANZ group and in Western Europe, both absolutely and relative to adults, and it devotes much of the 2026 edition to the possible role of social media and digital life in that decline.
Limitations and criticisms
The ranking is influential, but it is not a complete theory of the good life.
- First, it rests on a single life-evaluation question. That is a strength in terms of clarity and comparability, but it also means the table is best understood as a disciplined measure of subjective life satisfaction, not as a total quality-of-life score.
- Second, the six explanatory factors are often oversimplified in media coverage. The report itself repeatedly notes that they do not determine the ranking. They are correlates and decomposition tools, not the ranking formula. Misreading them as the formula can lead to simplistic claims such as “GDP explains everything” or “the score is just an index of governance.”
- Third, some scholars question whether average ladder responses are perfectly comparable across cultures and languages. The World Happiness Report itself acknowledges this debate and cites the concern raised by Bond and Lang that differences in scale use could alter rank order under some assumptions. That does not invalidate the ranking, but it is a real methodological caution.
- Fourth, other wellbeing frameworks can yield somewhat different “best country” lists because they measure more than life satisfaction. OECD wellbeing dashboards, for example, include a much wider set of outcomes, and recent reporting on flourishing research highlights that meaning, relationships, and purpose do not always move in lockstep with headline happiness ranks.
Open questions and limitations
One technical limitation in the public appendix material is that not every ranked country has every decomposition variable available in the published figures. Kosovo is the clearest top-20 example in this article: it is officially ranked 16th by happiness, but its healthy-life-expectancy value is not published in the appendix figure set used here, so the comparison table reports n/a rather than inserting a guess.
How to Interpret the Rankings
For individuals, the best use of the World Happiness Report is as a contextual indicator, not a relocation shopping list. A country can rank high on average while still being expensive, hard to access for migrants, unequal across regions, or weak for a specific age group or occupation. Conversely, a country can rank below the very top and still be ideal for a particular person because of language, family ties, climate, profession, or immigration pathway.
A better reading strategy is to combine three lenses. First, look at the level: where is the country today? Second, look at the trend: is life evaluation rising or falling over the last decade? Third, look at the profile: is the country strong because of income, support, trust, freedom, health, or emotional life? This is where countries such as Costa Rica, Mexico, or Slovenia become more analytically interesting than a simple top-10 headline suggests.
For policy readers, the ranking is most useful when read alongside broader OECD and national wellbeing data. The OECD’s own flagship wellbeing report warns that many non-material aspects of wellbeing have shown limited resilience or deterioration since 2019, even where some material indicators improved. That matters because housing costs, weak trust, youth stress, loneliness, and reduced civic confidence can pull life evaluations down even when traditional macro indicators look respectable.
If you are evaluating countries for moving, studying, working, or investing, ask a more practical set of questions than “What rank is it?” Ask whether people have someone to count on, whether institutions are trusted, whether long working hours are normal, whether housing eats too much disposable income, and whether the country’s wellbeing trend is improving or eroding. That is much closer to the way the strongest happiness systems actually work in practice.
If you are considering relocation to one of the world’s happiest countries, leave a request for a personal consultation and our specialists will help you choose the best immigration pathway for your goals and lifestyle.
Schedule a free consultation and get detailed information from Unioncitizenship lawyers. Start the process today!

Expert Tips
The smartest way to use happiness rankings is to treat them as evidence of system quality, not as lifestyle branding. At policy level, the reliable signals are not just income growth but social support, institutional trust, affordable time, health, and the sense that people can shape their lives. WHR, OECD, and trust-survey evidence all point in that direction.
Three practical policy case studies stand out. Finland shows the importance of trust capital and stable social institutions. Denmark shows how work-life design and limited long-hours culture feed into wellbeing. Costa Rica shows that a country can outperform its income rank when freedom, social connectedness, and emotional life are stronger than outsiders assume.
For journalists, analysts, and decision-makers, the best practice is simple: always pair the latest rank with the trend, the confidence interval, and the profile of drivers. That prevents one-year overreaction and helps explain why a country moved. It also keeps the interpretation neutral across different political and cultural contexts.
For readers planning travel, study, or migration, use this article as a starting point and then compare your shortlist on housing affordability, labor-market fit, health access, language barriers, personal safety, and regional quality of life. National happiness averages are useful, but your own lived wellbeing will always depend on the match between the country and your actual life.
If you enjoy evidence-based global guides like this one, explore more data-driven insights on migration, quality of life, and long-term country trends — or leave a request for a personal consultation to find the best immigration solution for your goals.
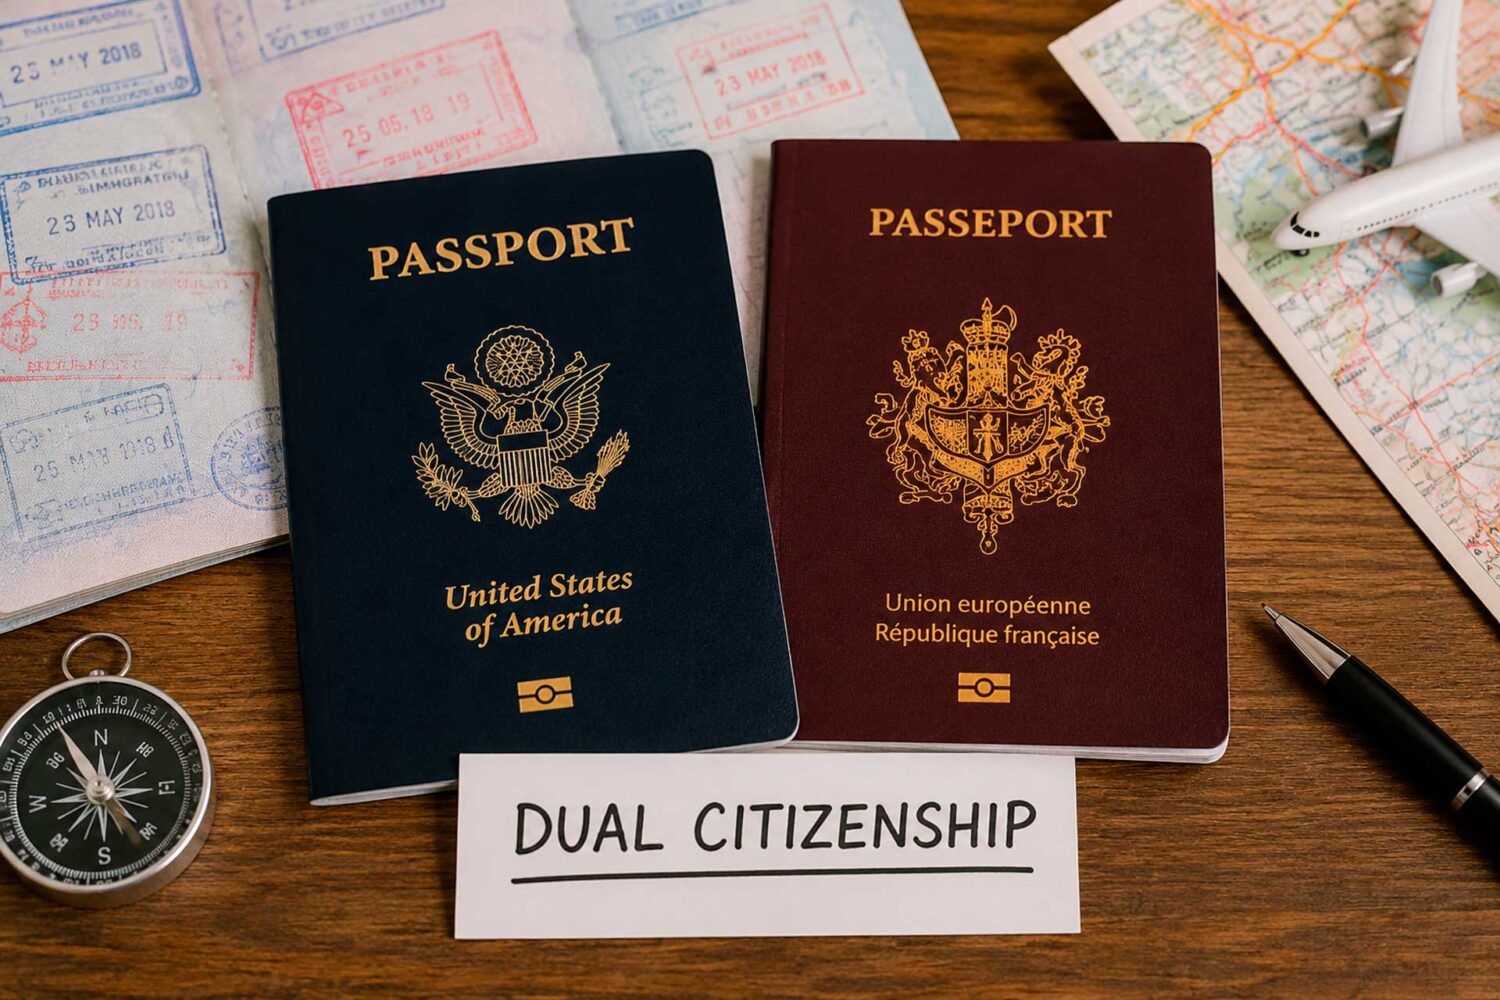


Find out details about obtaining an EU passport at a free consultation
Fill out a simple form and an immigration lawyer will contact you shortly.